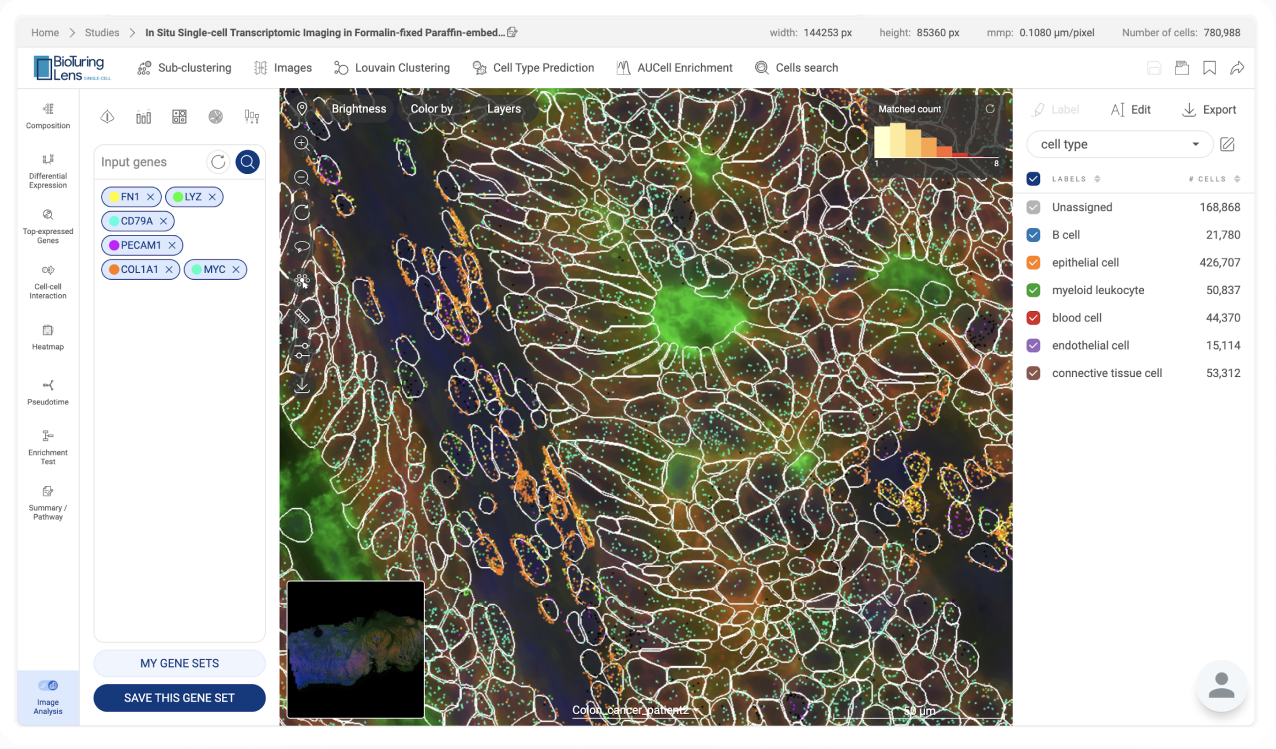
Interactive
image viewerA workspace designed to show specimen images with overlaid cell
segmentation, gene expression data, and annotations, providing a
comprehensive view of the data.
A user-friendly interface for interacting with multiple layers of
data.
Transcript
queryPinpoint transcript location of different genes in the dataset and
calculate
the expression value for each cell.
Top
expressed genesFind top expressed genes in a cell population and present the locations
of
their transcripts on the image.
Automatic
cell type labelingGenerate cell-type labels with the help of AI:
Automatic cell type prediction built upon BioTuring’s
comprehensive
database of over a hundred million single cells.
Automatic labeling using custom gene sets.
Annotate a small part of the data and let our machine learning
model
do the rest.
Annotation
toolsEasily select cells or regions and save their labels as metadata.
Cell-cell
interationAnnotate a small part of the data and let our machine learning
model
do the rest.
Taking advantage of the spatial context in spatial transcriptomics
data, this algorithm reveals interactions at the molecular level
between
neighboring cells.
Cell
searchCell search allows you to integrate the power of BioTuring’s single-cell
database into spatial transcriptomics data. You are now able to pull out
cell populations that share similar biological characteristics, or
biological signatures with your selected population from a huge
single-cell
database to expand your analysis.
MultiplexingAdjust each color channel to get the best fluorescent image.
Interactive
pathway visualizationMaking use of the publicly available WikiPathways database,
BBrowserX conducts pathway analysis with a collection of 900
pathways. It calculates the scores for each pathway and presents
users with the most prominent discoveries.
CompositionVisualize complex experimental designs and dataset components, such as
cell-type proportion in each sample.
AUCell
enrichmentIdentify cells enriched for an active gene set.
Interactive
pathway visualizationMaking use of the publicly available WikiPathways database,
BBrowserX conducts pathway analysis with a collection of 900
pathways. It calculates the scores for each pathway and presents
users with the most prominent discoveries.
Pathway
analysisIdentify potential biological processes based on the AUCell enrichment
score
by utilizing the biological pathway database WikiPathways and
calculating
the enrichment score based on AUCell scores.

 An
analytics platform supporting all of the latest spatial technologies with AI-assisted
features,
designed for scientists without coding experience.
